
Venn diagrams
Yorkshire-born Dr. John Venn (1834-1923) had two obsessions ~ logic and Cambridge University. His deep interest and skill in mathematics, probability and logic led to his development of what later became known as Venn diagrams. Venn spent most of his life at Cambridge, initially as a student, then a lecturer, professor and compiler of the University’s history.
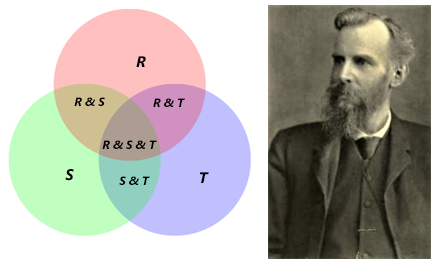
Whereas ‘Eulerian circles’ show only the known commonalities between categories/sets/classes, Venn diagrams display all possible commonalities, even the non-existent or unlikely ones. Sometimes this results in an empty area in the centre, where all the circles overlap, or there may be less crucial, outer segments that have no takers. Whatever the case, a Venn diagram is an excellent visual aid to sorting out the nuts and bolts of a situation and can be used alongside or even instead of algebra to pinpoint a desired state, taking everything into account.

Venn owned a huge collection of publications on the subject of logic and himself wrote ‘The Logic of Chance’ (1866) and ‘Symbolic Logic’ (1881), the latter containing the first illustrations of his diagrams. He also wrote a history of his College at Cambridge and, with his son John A. Venn (1883-1958), published several volumes detailing all of Cambridge’s alumni.
(Top right image of John Venn [cropped]: Bradford Timeline at Flickr.com / CC BY-NC 2.0)